Powerdome
Interaktive Visuailsierungen für ein immersives Displaysystem
- Prof. Boris Müller
- Prof. Dr. Till Nagel
- Prof. Klaus Dufke
- Carl Zeiss Jena
- Fraunhofer FIRST
- Urania Potsdam
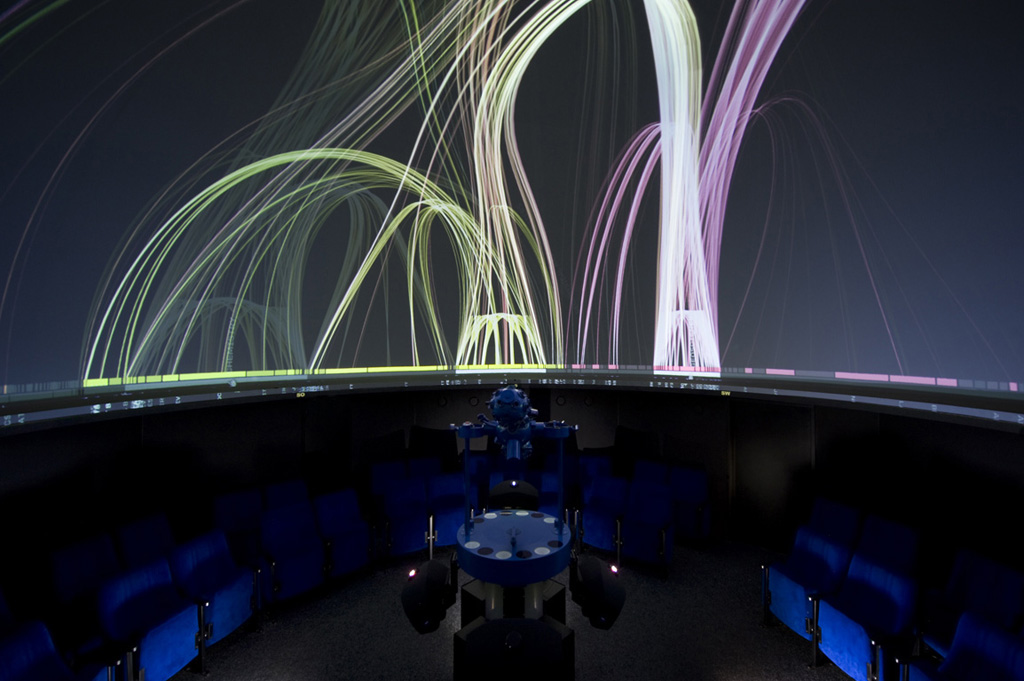
Das Powerdome-System ist das Ergebnis einer einzigartigen Zusammenarbeit zwischen Carl Zeiss Jena, Fraunhofer FIRST und dem Fachgebiet Interface Design der Fachhochschule Potsdam. Es ermöglicht uns, Echtzeitmedien und interaktive Visualisierungen in einer Fulldome-Umgebung zu projizieren. Das System gibt uns die Möglichkeit, neue und innovative interaktive Erfahrungen in einem immersiven Raum zu entwickeln.
Der Powerdome befindet sich im Urania Planetarium in Potsdam. Es bereichert das Spektrum der astronomischen Präsentationen des Planetariums und bietet technische Möglichkeiten, die weit über die Vermittlung astronomischer Inhalte hinausgehen. Seitens der FH Potsdam liegt der Schwerpunkt auf der interaktiven Visualisierung von Informationen und Daten, einem der großen Forschungsgebiete des Interaction Design Lab und der FH Potsdam im Allgemeinen.
Mit einem Kuppelprojektionssystem wie dem Powerdome können sowohl didaktisch-narrative als auch wissenschaftlich-explorative Ziele verfolgt werden. In jedem Fall geht es um die Visualisierung und Vermittlung von komplexem Wissen.
Um diesen besonderen Anforderungen gerecht zu werden, haben Fraunhofer FIRST und die FH Potsdam gemeinsam den Powerdome ImageGenerator weiterentwickelt. Das modifizierte System ermöglicht es, auf jedes visuelle Format in Echtzeit zuzugreifen und es auf der Kuppel zu präsentieren. Es ermöglicht Ingenieuren und Designern, ein breites Spektrum an Visualisierungen für einen wissenschaftlichen Kontext zu entwickeln. Die hohe Auflösung des Powerdome ermöglicht detailgetreue Präsentationen, während die räumliche Struktur der Kuppelprojektion das Eintauchen in interaktive Datenwelten ermöglicht.